
Figure 3. Comparison of anoxia-sensitive difference currents in neonatal chromaffin cells.
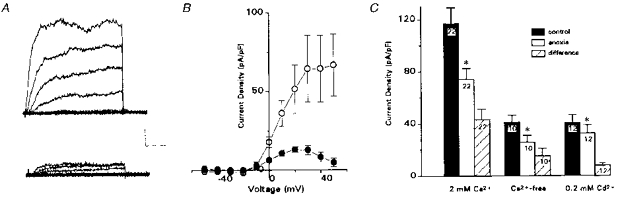
A, anoxia-sensitive difference currents, obtained by subtracting current traces recorded during anoxia from corresponding ones in normoxia, shown in normal Ca2+-containing (upper traces) and Ca2+- free (lower traces) solutions. Subtracted traces are for 10 mV incremental steps between −50 and +30 mV; holding potential was −60 mV. Note the larger component of the anoxia-sensitive difference current is Ca2+ sensitive; lower traces represent the Ca2+-independent O2-sensitive current, IK(VO2). Vertical scale bar represents 100 pA, horizontal scale bar represents 10 ms. B, current density vs. voltage plots for 6 representative cells, showing the total (mean ± s.e.m.) anoxia-sensitive component, IK(O2) (○) and IK(VO2) (•; recorded in 200 μm Cd2+). C, comparison of mean (± s.e.m.) outward current density at +30 mV, for all cells investigated in normal Ca2+ (2 mm), Ca2+-free and Cd2+-containing (200 μm) bathing solutions. * Significantly different from control group (P < 0.05). The mean current density (at +30 mV) during anoxia in the presence of Cd2+, or in Ca2+-free solutions, was significantly different from that in the presence of 2 mm Ca2+ (P < 0.01).