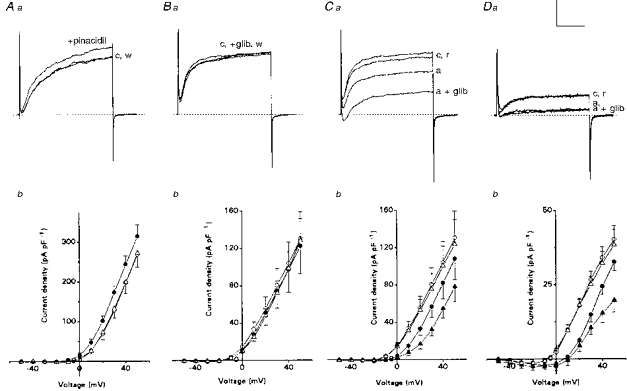
Figure 4. Comparison of the effects of KATP channel modulators on K+ current and K+ current density recorded during normoxia or anoxia in neonatal AMC.

All current records are shown for cells studied under voltage clamp, and representative traces are shown for the voltage step from −60 to +30 mV. Aa and b: in normoxia, effects of pinacidil (100 μm), an activator of IK(ATP), on outward currents and current density. Note that sequential application of pinacidil (+pinacidil, •), increases outward current above control (c, ○), and the effect was reversible after washout (w, ▵). Mean (± s.e.m.) K+ current density is shown for a group of 5 cells, indicating that pinacidil significantly increased K+ current density relative to control at all voltage steps between 0 and +50 mV (P < 0.05). Ba and b: current records in normoxia for cells (n = 9) treated with control saline (c, ○), 50 μm glibenclamide (+glib, •), a blocker of IK(ATP), and after washout (w, ▵) of this drug. Mean (± s.e.m.) K+ current density vs. voltage plot for 9 cells shows that glibenclamide did not significantly affect outward current density. Ca and b: effect of simultaneous exposure to anoxia and glibenclamide on outward current for the same 9 cells as in B. Cells were sequentially exposed to normoxia/control (c, ○), anoxia (a, •), anoxia plus glibenclamide (a + glib, ▴) and recovery (r, ▵). Note that the inhibitory effect of anoxia (a) on the outward current was greatly exaggerated in the presence of glibenclamide. Current density in anoxia was significantly less than normoxic control at all voltage steps between 0 and +50 mV (P < 0.01); also, current density in anoxia plus glibenclamide was significantly less than anoxia alone, between −20 and +30 mV (P < 0.05). Da and b: outward current and current density recorded in the presence of Cd2+ (200 μm), to block Ca2+-dependent K+ currents. Note that anoxia (a) reversibly suppressed the outward current, but addition of 50 μm glibenclamide (a + glib) had no additional suppressive effect during anoxia (compare Ca), suggesting that IK(ATP) is Ca2+ dependent. Mean (± s.e.m.) K+ current density vs. voltage plot is for a group of 7 cells and shows that anoxia significantly (P < 0.01) suppressed outward currents in the presence of Cd2+ at all potentials between −10 and +50 mV. In the presence of glibenclamide, the additional suppression of outward current by anoxia was absent at all test potentials below +40 mV (P > 0.05). Symbols are the same as in C. This suggests IK(ATP) is Ca2+ sensitive. Vertical scale represents 400 pA in A, B and C and 100 pA in D. Horizontal scale represents 30 ms.
