
Figure 2. Acceleration of calcium current rise time by a conditioning pulse.
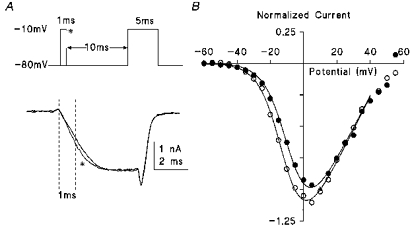
A, IpCa (lower traces) was evoked by a test pulse (5 ms duration to −10 mV) in the presence (*) or absence of a conditioning prepulse (1 ms, to −10 mV) applied 10 ms prior to the test pulse (voltage protocol indicated in upper panel). Holding potential was −80 mV. B, the current-voltage relationship measured 1 ms from the pulse onset (dashed line in A) with current normalized to the amplitude of control current at +10 mV (*). Test pulse command voltage was varied. The mean current amplitude plotted from 3 calyces is plotted in the presence (○) and absence (•) of the 1 ms conditioning pulse. The continuous lines are drawn according to a modified Boltzmann equation (see Methods). In control (no prepulse), V1/2 was −7.5 mV. The facilitation of IpCa could be explained by a hyperpolarizing shift of −4.1 mV in V1/2 (with k = 7 for control and test data).