
Figure 4. Calcium dependence of IpCa facilitation.
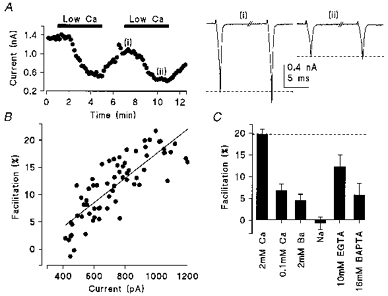
A, time plot of the amplitude of the calcium current during switched perfusion with 0.1 mm [Ca2+]o (filled bars) and 2 mm [Ca2+]o. Sample traces show paired pulse facilitation (10 ms inter-pulse interval) at 2 mm (i) and 0.1 mm [Ca2+]o (ii). The depolarizing test pulse was to −10 mV. B, relationship between the magnitude of facilitation and IpCa. The parameters are strongly correlated (r2 = 0.65) suggesting that calcium influx is involved in generating facilitation. Data points were taken from the 2–12 min time period in A, including wash-in and wash-out of 0.1 mm [Ca2+]o. C, effect of several manipulations which reduce calcium influx or intracellular calcium concentration on IpCa facilitation.