
Figure 3. Ca2+ transients in TR and NON ventricular myocytes.
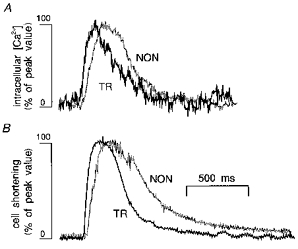
Typical Ca2+ transients (A) and twitches (B) recorded in TR (black traces) and NON (grey traces) myocytes elicited by field stimulation at 0.5 Hz. Traces were scaled and superimposed to compare the time courses of the signals. Both changes in cell length and intracellular [Ca2+] were faster in TR than in NON myocytes.