
Figure 5. Effects of Cl− channel blockers on cAMP-activated Cl− currents.
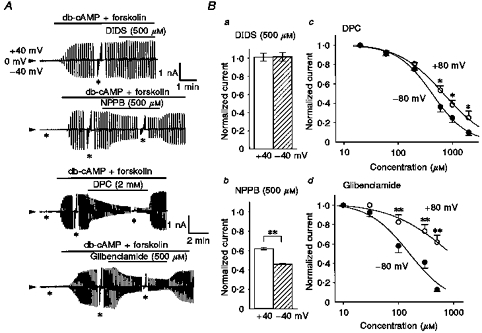
Whole-cell recordings were performed in single Paneth cells equilibrated with NaCl solutions. A, representative records before and after cAMP stimulation (500 μm db-cAMP and 20 μm forskolin) and drug application (indicated by horizontal bars) during application of alternating pulses or step pulses. The gain of the chart recorder was changed by one-half during the step pulses (asterisks). The upper time scale applies to both the top and second traces, and the lower scale to both the third and bottom traces. B, mean values of normalized peak currents in the presence of 500 μm DIDS (a), 500 μm NPPB (b), various concentrations of DPC (c) or glibenclamide (d) against control currents in the absence of drugs at ±40 mV or ±80 mV. Error bars represent s.e.m. (n = 4–8). *P < 0.05 and **P < 0.01, significant difference between data recorded at +40 and −40 mV, or those at +80 and −80 mV. Curves in c and d represent the best fits to the Hill equation. The Hill coefficients for DPC were 1.35 ± 0.13 at −80 mV and 1.03 ± 0.09 at +80 mV and those for glibenclamide were 1.18 ± 0.33 at −80 mV and 0.80 ± 0.23 at +80 mV.