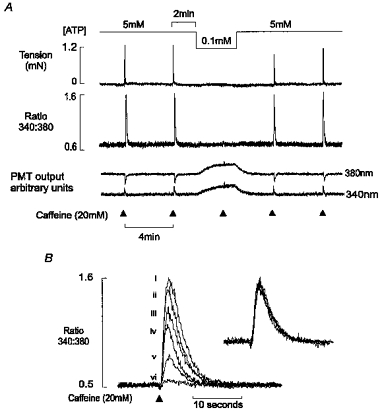
Figure 2. The effect of cytosolic [ATP] on caffeine-induced Ca2+ release.

A, simultaneous records of the isometric tension (upper panel), the 340 nm/380 nm fluorescence ratio (middle panel) and the 340 and 380 nm fluorescence signals are shown. Reduction in the bathing [ATP] caused a marked decrease in the caffeine-induced Ca2+ transient. The decrease in [ATP] was associated with a parallel increase in the 340 nm and 380 nm signals, with no effect on the ratio. B, superimposed caffeine-induced Ca2+ transients in the presence of [ATP] (mm): (i) 5, (ii) 4, (iii) 3, (iv) 2, (v) 1 and (vi) 0.1. Inset shows normalized responses. All data are from the same preparation.
