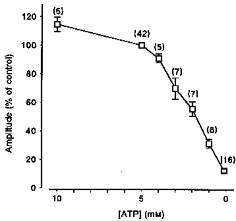
Figure 3. Cumulative data showing the relationship between the cytosolic [ATP] and the amplitude of the caffeine-induced Ca2+ transient.

Each point is the mean (± s.e.m.) expressed as a percentage of the control response obtained in the presence of 5 mm ATP using the protocol shown in Fig. 2A. The number of preparations is indicated in parentheses.
