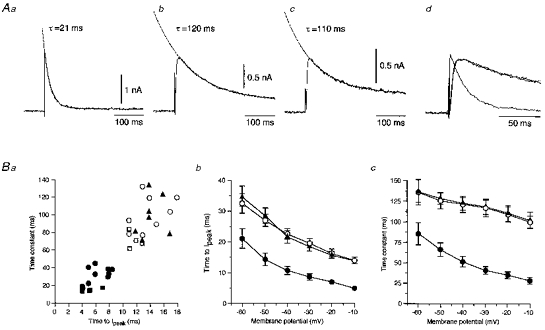
Figure 5. Time course of the isolated A-currents.

A, the isolated fast A-current recorded from the superior salivatory neurones labelled from the chorda-lingual nerve (a) and the slow A-currents recorded from neurones labelled from the nerve (b) and the tongue (c). Traces of a, b and c were superimposed at a faster time base in d. Ba, relationships between the decay time constants and the time to peak of the isolated fast (n = 12: •, recorded from the neurones labelled from the chorda-lingual nerve) and slow A-currents (n = 8: ○, recorded from the neurones labelled from the chorda-lingual nerve; n = 7: ▴, recorded from those labelled from the tongue). ○ (n = 4) and □ (n = 4) indicate the values of the isolated fast and slow A-currents, respectively, obtained from 14- to 15-day-old rats. Each value was obtained at −10 mV. The mean time to peak (b) and the mean decay time constant (c) decreased with the membrane depolarization of test pulses.
