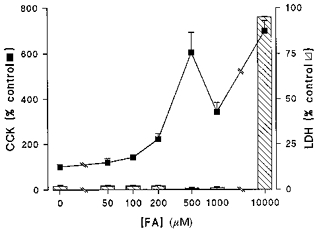
Figure 3. Relationship between C12-induced CCK secretion and LDH release.

STC-1 cells were exposed to varying concentrations (0–10 mm) of C12 FA over 15 min after which the medium was assayed for CCK and LDH activity. CCK results are expressed as a percentage of secretion in the absence of C12. LDH is expressed as the percentage of total cell-associated activity. Results are means + s.e.m. from n = 5 experiments in each group except 10 mm C12 where n = 3.
