
Figure 2. Relationship between log concentration of dopamine and the response of in vitro lungs from fetal guinea-pigs.
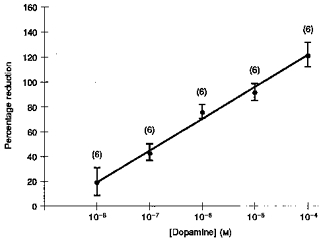
Ordinate: responses quantified as the percentage reduction of resting fluid production (first hour) during the hour of treatment (second hour). Vertical bars show ± s.e.m.; numbers above the bars give the number of preparations tested. Abscissa: concentrations of dopamine (M).