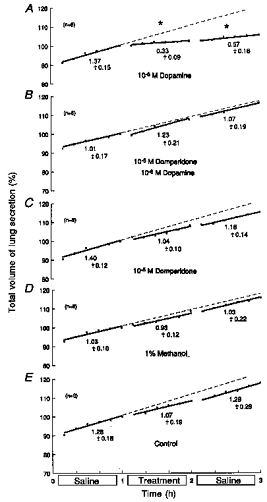
Figure 5. Effects of domperidone on responses to dopamine.

Based on 30 fetuses of 61 ± 2 days of gestation and 81.4 ± 11.8 g body wt (means ± s.d.). During the middle hour, lungs were immersed in saline containing: 10−6 m dopamine alone (A); 10−6 m dopamine with 10−5 m domperidone (B); 10−5 m domperidone alone (C); 1 % methanol (solvent) alone (D); or saline alone (untreated controls) (E). Ordinates: total volume of lung liquid expressed as a percentage of that immediately before treatment, where 100 % was: 1.05 ± 0.16 ml (means ± s.d.) (A); 0.91 ± 0.22 ml (B); 1.04 ± 0.17 ml (C); 1.01 ± 0.08 ml (D); and 1.05 ± 0.28 ml (E). Abscissae: time in hours. All regressions are lines of best fit; slopes represent production rates. Values below the lines are average production rates in ml (kg body wt)−1 h−1. Asterisks above the lines show significant changes from the rate of production in the first hour (ANOVA). Standard errors of the mean are omitted for clarity, but they averaged: 1.05 ± 0.16 (A); 1.48 ± 0.20 (B); 0.71 ± 0.11 (C); 0.95 ± 0.12 (D); and 0.94 ± 0.14 (E). Corresponding coefficients of variation were: 2.61 ± 0.30 % (A); 3.38 ± 0.41 % (B); 1.66 ± 0.24 % (C); 2.18 ± 0.26 % (D); and 2.19 ± 0.30 % (E).
