
Figure 1. Pharmacological induction and receptor mechanisms of cortical gamma oscillations in vitro.
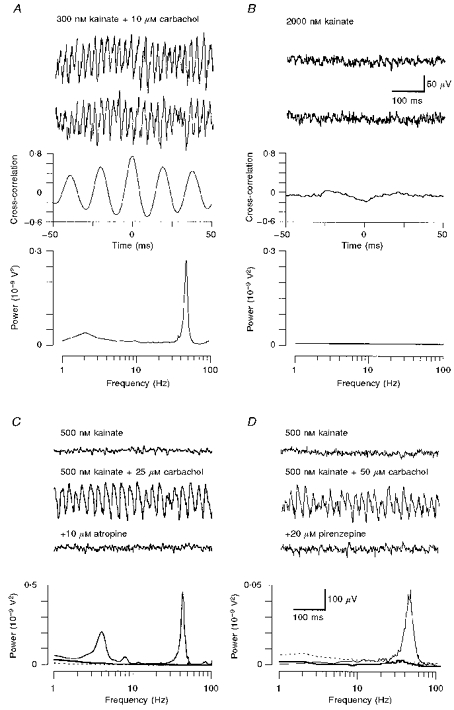
A, extracellular recordings of two neighbouring layer 4 sites showing the induction of oscillatory network activity due to the conjoint action of kainate and carbachol. Cross-correlograms reveal a high degree of synchrony, whereas the power spectrum shows a prominent peak in the gamma frequency range. B, control experiment demonstrating that within layer 4, kainate alone failed to induce gamma oscillations. C, the muscarinic antagonist atropine potently blocked oscillatory activity elicited by carbachol in layer 5/6. D, likewise, the specific M1 receptor antagonist pirenzepine was also effective in reversibly antagonizing gamma frequency network oscillations. The interrupted lines in the corresponding power spectra (bottom panels) denote baseline activity (kainate only); continuous lines (addition of carbachol) reveal a clear increase of power in the gamma frequency spectrum, whereas both muscarinic antagonists (thick lines) reduce spectral activity back to baseline levels. Calibration bars in B are for panels A and B, those in D are for C and D.