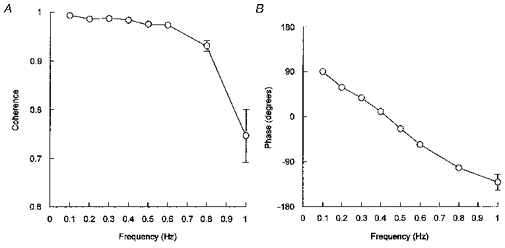
Figure 4. Cross-spectral analysis between mean arterial pressure and aortic nerve stimulation.

In each rat (n = 13), coherence (A) and phase angle (B) were computed with the impulses delivered by the stimulator as the input signal and mean arterial pressure as the output signal.
