
Figure 5. High-resolution samples of single peptide-gated channel activity at various concentrations of FLRFamide.
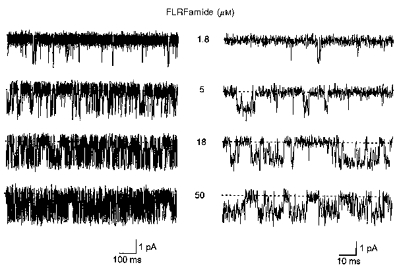
The concentration of FLRFamide (1.8–50 μm) is shown near each current trace. The traces are shown on a more expanded time scale in the right panel. Baselines are shown by dashed lines. The membrane potential was −80 mV and the traces were low-pass filtered at 2 kHz (−3 dB). The patch contained only one peptide-gated Na+ channel.