
Figure 7. Distribution of all closed times.
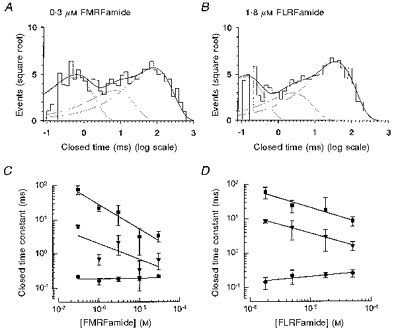
The distributions of all closed times of a single channel activated by FMRFamide (A; 593 closings, 0.3 μm), and FLRFamide (B; 573 closings, 1.8 μm) are shown. The distributions are fitted with the sum of three exponential components with parameters (mean time constant (relative area)) of 0.56 ms (33 %), 7.13 ms (16 %) and 88.7 ms (51 %) for FMRFamide and 0.12 ms (30 %), 2.43 ms (12 %) and 35.4 ms (58 %) for FLRFamide. The mean closed time constants are shown as a function of peptide concentration for FMRFamide (C) and FLRFamide (D). •, ▾ and ▪, first, second and third components of the closed time distributions, respectively. Continuous lines through the data points were drawn by hand. The membrane potential was −80 mV and the recording was low-pass filtered at 2 kHz (−3 dB). Points are given as the mean of 4 or 5 experiments.