
Figure 8. Distribution of burst durations.
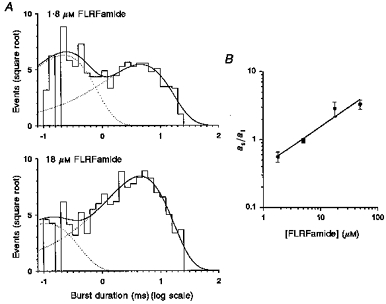
The distribution of burst durations of a single channel activated by FLRFamide is shown in A. In the top panel (1.8 μm FLRFamide), the sample contained 593 bursts and the critical interburst closed time (tcrit) was 3.06 ms. In the lower panel (18 μm FLRFamide), the sample comprised 886 bursts and the critical interburst closed time (tcrit) was 1.14 ms. The distributions were fitted with the sum (continuous lines) of two exponential components with parameters of (mean time constant (relative area)): 0.23 ms (57 %) and 4.62 ms (43 %) for 1.8 μm FLRFamide and 0.11 ms (20 %) and 4.61 ms (80 %) for 18 μm FLRFamide. The ratio of the relative area of the slower component to that of the faster component (as/af) is depicted as a function of FLRFamide concentration in B. The membrane potential was −80 mV and the recording was low-pass filtered at 2 kHz (−3 dB). Points are given as the mean ± s.e.m. (N = 4–5).