
Figure 9. Distributions of open times within bursts and of the number of openings per burst.
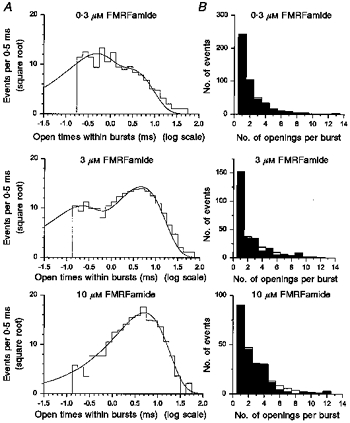
The distribution of open times within bursts with three concentrations of FMRFamide (top, 1534 openings, 0.3 μm; middle, 2343 openings, 3 μm; bottom, 610 openings, 10 μm) is shown in A. The critical interburst closed times were 13.79 ms for 0.3 μm, 1.94 ms for 3 μm, and 0.35 ms for 10 μm FMRFamide. The distribution was fitted with the sum of two exponential components (continuous lines) with parameters of (mean time constant (relative area)): 0.40 ms (59 %) and 2.60 ms (41 %) for 0.3 μm FMRFamide, 0.18 ms (30 %) and 4.66 ms (70 %) for 3.0 μm FMRFamide, and 0.29 ms (5 %) and 5.07 ms (95 %) for 10 μm FMRFamide. The membrane potential was −80 mV and the recording was low-pass filtered at 2 kHz (−3 dB). The distribution (filled bars) of the number of openings per burst at three concentrations of FMRFamide (top, 0.3 μm; middle, 3 μm; bottom, 10 μm) is shown in B. The distribution was fitted with the sum of two geometrics (open bars) with parameters of (mean number (relative area)): 1.4 (47 %) and 2.9 (53 %) for 0.3 μm FMRFamide, 1.1 (27 %) and 2.7 (73 %) for 3.0 μm FMRFamide, and 1.0 (8 %) and 2.9 (92 %) for 10 μm FMRFamide.