
Figure 2. Activity-dependent conduction block in an α-motor axon innervating tibialis anterior.
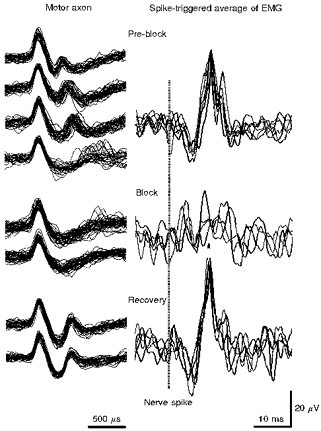
The traces on the left represent superimposed consecutive action potentials recorded at different stages during the development of conduction block and, after rest, recovery therefrom, for a motor axon discharging in a voluntary contraction. The traces on the right represent spike-triggered averages of surface EMG of tibialis anterior, each trace consisting of approximately 32 sweeps, corresponding to those on the left. The timing of the nerve action potential is indicated by the interrupted vertical line. In the top left panel a second positive peak was seen in each recording, though the interpeak interval gradually increased and became highly unstable in the fourth trace. The EMG potential was consistently recordable. In the middle panel (Block), the second positive peak was present only in a few sweeps making up the upper trace. There was no consistent EMG potential. Following rest for a few minutes, a further contraction was performed, and the second positive peak was again present in the nerve action potential, and the EMG potential had reappeared (bottom panel). Note the difference in time base for the nerve action potential and the EMG potential. The longest interpeak interval (fourth set of traces under Pre-block) was 1.43 ms.