
Figure 2. Distribution of single motor unit recruitment thresholds and contractile properties.
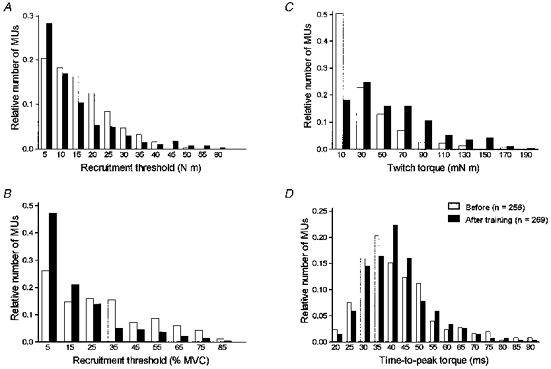
Histograms showing the distribution of single motor unit (MU) recruitment thresholds for all subjects expressed either as an absolute value (A) or as a percentage of MVC (B), twitch torques (C) or the time-to-peak torque (D) before and after training. Whereas no significant difference was observed before and after training for the time-to-peak torque distributions (Student's t test), the distributions of the recruitment thresholds and the twitch torques are significantly different (Kolmogorov-Smirnov two-sample test).