
Figure 4. Summary diagram showing volume changes in hepatosplanchnic and extra-splanchnic regions in response to changes in carotid pressure.
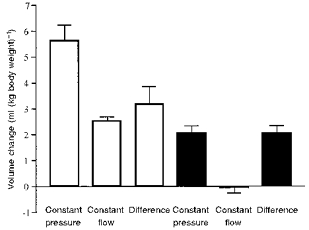
Values are means ± s.e.m. from 8 dogs and represent averages of increases in volumes to increases in carotid pressure, and decreases in volume to decreases in carotid pressure. Note that, in the hepatosplanchnic region (□), the active contribution (during constant flow) represents about half the total response (during constant pressure). In the extra-splanchnic circulation (▪), there was no active contribution and the entire response was estimated to be passive.