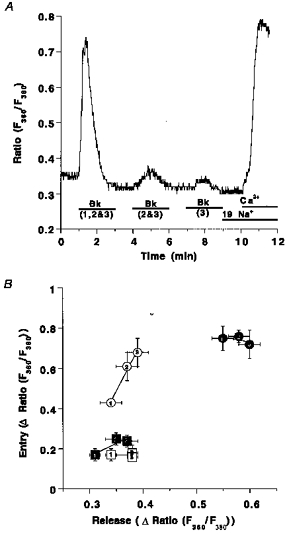
Figure 8. Correlation of Ca2+ release and CCE on repetitive stimulation with Bk in normal and low [Na+] conditions in the absence and presence of ryanodine.

Panel A shows the experimental protocol: fura-2-loaded endothelial cells freshly isolated from bovine circumflex arteries were stimulated with 100 nmol l−1 Bk for 2 min either at time point 1 min (1), at time points 1 and 4 min (2) or at time points 1, 4 and 7 min (3). At time 9 min [Na+]o was set to 19 mmol l−1 and 2.5 mmol l−1 Ca2+ was added at time 10 min. Panel B, elevation of [Ca2+]pn to Bk at time 1 min (1), or the total sum of the increases of [Ca2+]pn upon two (2: 1st peak plus 2nd peak) or three (3: 1st peak plus 2nd peak plus 3rd peak) stimulations is shown on the x-axis. The increase in [Ca2+]pn to the addition of Ca2+ is shown on the y-axis. Bk stimulation was performed in Ca2+-free HBS containing 145 mmol l−1 Na+ (○), 19 mmol l−1 Na+ (•), 145 mmol l−1 Na+ and 25 μmmu;mol l−1 ryanodine (□) and 19 mmol l−1 Na+ plus 25 μmmu;mol l−1 ryanodine (▪). Each point represents the mean ±s.e.m. (n= 12).
