
Figure 7. Dissociation between Ca2+ release and activation of capacitative Ca2+ entry.
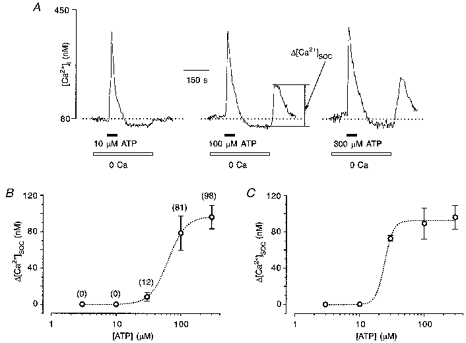
A, glioma cells were stimulated by different concentrations of ATP in the absence of extracellular Ca2+, extracellular Ca2+ was then restored to 2 mM. The amplitude of [Ca2+]i rise in response to Ca2+ restoration was determined as the amplitude of the capacitative Ca2+ entry-induced [Ca2+]i transient, Δ[Ca2+]SOC. The traces are representative for four independent experiments, 157 cells. B, from the experiments shown in A, the dose-response curve, relating ATP concentration to normalized Δ[Ca2+]SOC, was constructed. The apparent KD was 63 mM, and the Hill coefficient was 3.2. The numbers in parentheses indicate the percentage of cells which responded with [Ca2+]i transients resulting from store-operated Ca2+ entry. C, from the same experiments the mean values of Δ[Ca2+]SOC were calculated for responsive cells only. The dose-response curve has an apparent KD of 24 mM and a Hill coefficient of 6.5.