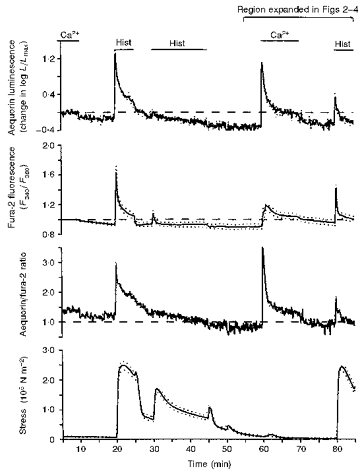
Figure 1. Demonstration of the protocol for studying the mechanism for refilling of the sarcoplasmic reticulum with Ca2+.

Time courses are shown for aequorin-estimated [Ca2+]i (change in logL/Lmax, top panel), fura-2-estimated [Ca2+]i (background corrected 340/380 fluorescence ratio, second panel), the aequorin/fura-2 ratio (third panel), and active stress (× 105 N m−2, bottom panel). Data are from for swine carotid medial tissues (n= 4–6). Extracellular Ca2+ was nominally removed at 10 min by changing the bathing solution to a solution with no added Ca2+. At 20 min, some of the tissues were treated with 10 μM CPA (e.g. Fig. 4, not shown in this experiment), which was then present in all subsequent solutions and other tissues were not treated with CPA. At 20 min, the tissues were stimulated with 100 μM histamine (Hist) for 5 min and the histamine was then washed out. At 30 min, the tissues were stimulated with 100 μM histamine for 15 min and the histamine was then washed out. At 60 min, extracellular Ca2+ was restored to the tissues for 10 min. In some experiments this solution contained other activating agents. At 70 min, extracellular Ca2+ was removed. At 80 min, the tissues were stimulated with 100 μM histamine. The data collected from 55 to 85 min are expanded in the subsequent Figs 2–4. Data were collected at 1 s intervals and averaged over 10 s for plotting. Mean data values are shown as a continuous line and the dotted lines represent ± 1 s.e.m. Only stress from the fura-2 experiments are shown for clarity (the aequorin stress data were similar).
