
Figure 3. Structure-activity (A and B) and concentration-response (C) relationships.
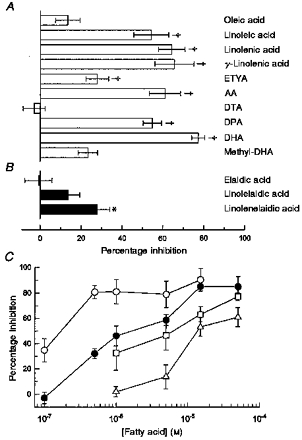
Mean percentage inhibition (±s.e.m.), at 5–6 min exposure time, plotted for 13 different compounds. A, 10 compounds with cis-unsaturated bonds. B, 3 isomers with trans-unsaturated bonds. All compounds were tested at a concentration of 50 μm on cultured hippocampal neurons. The number of cells tested with each compound ranged from 4 to 11; their common names or abbreviations are given to the right of each bar. ETYA, eicosatetraynoic acid; DTA, docosatrienoic acid; DPA, docosapentaenoic acid. Compounds that produced significant inhibition are indicated: *P < 0.05, †P < 0.01. C, mean percentage inhibition (±s.e.m.), at 5–6 min exposure time, plotted versus fatty acid concentration for hippocampal neurons (AA,▵ DHA, □) and HEK 293 cells expressing GluR6 (AA, • DHA, ○). The number of cells tested at each concentration ranged from 3 to 10.