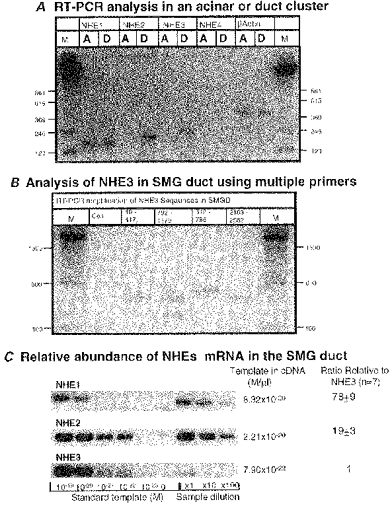
Figure 1. Analysis of NHE isoforms in SMG cells by RT-PCR.

The presence and relative amounts of mRNA of each NHE isoform were analysed by RT-PCR A, the cDNA from a single acinar cluster (lanes labelled A) or a single duct fragment (lanes labelled D) was amplified using isoform-specific primer sets. B, four sets of rat NHE3 specific primers were used to amplify sequences of an N-terminus, two putative amiloride binding regions and a C-terminus of NHE3 mRNA. The lane labelled Con is a representative (N-terminus: 19-417) of negative control PCR reactions without template. C, relative amounts of each NHE mRNA in the same cDNA samples from ducts were measured by a semi-quantitative RT-PCR.
