
Figure 3. Group mean head lateral angular velocity during voluntary movement and GVS.
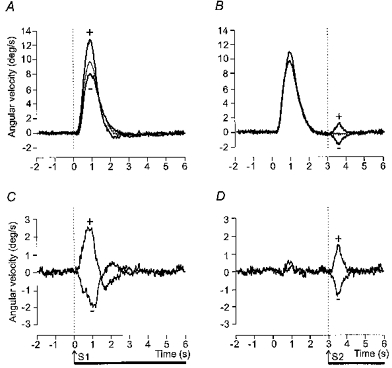
Upper panels (A and B) show superimposed the mean lateral angular velocity of the head in space for control movements (thin lines) and movements during which GVS was applied (thick lines). The movement cue was given at 0 s. Movements to the right and left have been averaged after inversion of traces from leftward movements. The trials in which GVS was applied have been sorted according to whether a given polarity of stimulation produced either greater deviation of the body in the direction of the movement (+) or less deviation (=) (see Fig. 1). Lower panels (C and D) show the same data after subtraction of the control movement (without stimulation) trace from the trials in which GVS was applied. In A and C GVS began at the same time as the movement cue. In B and D GVS began 3 s after the auditory cue when the movement was completed