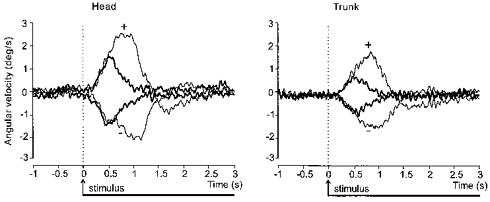
Figure 4. Net effect of GVS on group mean head and trunk lateral angular velocity.

Superimposed traces showing the net effect of the two polarities (+ and −; see Fig. 3 legend) of GVS, after subtraction of the control movement as in Fig. 3C and D, on the lateral angular velocity of the head (left panel) and trunk (right panel) in space. The traces have been realigned to the onset of stimulation at 0 s. GVS began either at the same time as the movement cue (thin lines) or 3 s after the cue when the movement was completed (thick lines).
