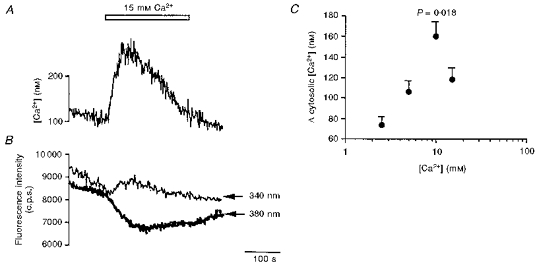
Figure 1. TM3 cell responses to elevations of extracellular [Ca2+].

A and B, representative traces showing the effects of elevating extracellular [Ca2+] to 15 mM on cytosolic [Ca2+] (nM) (A) and fluorescence intensities (counts per second (c.p.s.)) at excitation wavelengths of 340 and 380 nm (B) in cultured TM3 cells (for details see Methods). C, effect of a range of extracellular [Ca2+] on the mean peak change (Δ) in cytosolic [Ca2+] (nM). The latter data points were derived by subtracting the basal from peak cytosolic [Ca2+]. Each data point (mean +s.e.m.) was then compared with the response to 2.5 mM [Ca2+] (regarded as the control) by ANOVA with Bonferroni's correction for inequality. Except for 10 mM [Ca2+], the rest of the points were not significantly different (P > 0.05) from control (n = 4–6 for each point).
