
Figure 2. Mean arterial blood pressure and vascular conductances during the dehydration and control trials.
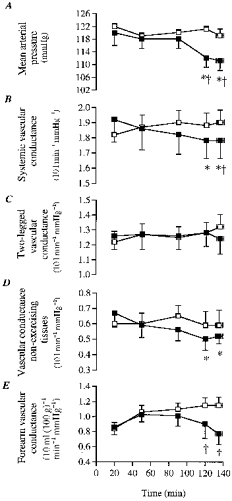
A, mean arterial blood pressure; B, systemic vascular conductance; C, 2-legged vascular conductance; D, non-exercising tissues vascular conductance; E, forearm vascular conductance. Conductance units in B, C, D and E were multiplied by 10 (e.g. 10 l min−1 mmHg−1). * Significantly lower than 20 min value (P < 0.05). † Significantly lower than control (P < 0.05).