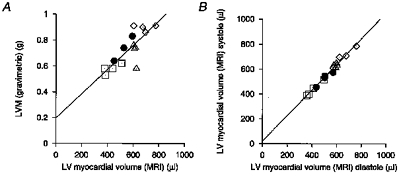
Figure 5. Left ventricular muscle volumes.

A, correlation of LV myocardial volume determined by MRI and post-mortem LV mass (r = 0.81). The line shows the least squares fit for these data (y = 0.94 (± 0.18)x+ 0.20 (±0.10) g), giving an estimated myocardial density of 0.94 (± 0.18) g cm−3. B, correlation of the MRI determined LV myocardial volume towards end-systole and end-diastole (r = 0.99). The LV muscle volume was determined at each time point (typically 12 of them) for each rat. The volume at each of three time points near end-systole and diastole was used to give a mean LV muscle volume at these two points in the cardiac cycle; these are the volumes correlated here. A linear least squares fit gave y = 1.03 (± 0.04)x+ 20 (± 21) μl, indicating a close agreement between LV muscle volume determined, at these two points in the cardiac cycle, from the MR images. 68.3% confidence intervals are given in parentheses. □, 8 week WKY; •, 12 week WKY; ▵, 8 week SHR; ⋄, 12 week SHR.
