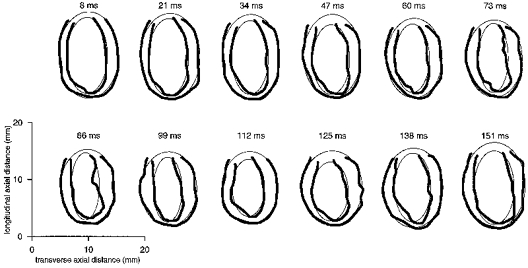
Figure 8. Left ventricular borders and fitted ellipses from longitudinal image sections.

A series of epi- and endocardial borders (thick lines) and corresponding fitted ellipses (thin lines), for a single longitudinal cardiac slice, of a similar type to those shown in Fig. 2, through the widest point across the left ventricle. Borders are shown for all 12 cardiac time points imaged during the cardiac cycle in an 8-week-old male WKY (body weight 203 g, heart rate 353 ± 5 beats min−1). The time indicated above each panel is the delay after the trigger, taken from the R wave of the ECG, at which the image corresponding to the borders was acquired. The interactively defined epicardial borders lie outside the endocardial borders. The incompleteness of the borders at one end of the ventricle reflects the presence of the aortic outflow. Contraction of the ventricle and corresponding thickening of the myocardial wall can be seen during systole (8–99 ms) after the trigger, followed by an expansion of the ventricle during diastole.
