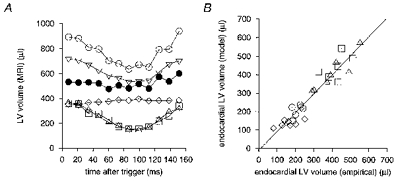
Figure 9. Comparison of modelled and empirical left ventricular volume.

A, endo-, epi- and myocardial LV volumes plotted against time after the R wave trigger, both empirically derived from the multislice transverse images (▵, endocardial; ▿, epicardial; ⋄, myocardial) and derived from the single slice elliptical model (□, endocardial; ○, epicardial; •, myocardial). The modelled data were extracted from the same animal as that displayed in Fig. 8. Modelled and empirical endocardial volumes are in close agreement throughout the cardiac cycle, while the epicardial and consequently the myocardial volumes are consistently overestimated by the elliptical model when compared with the empirical values. B, a comparison of the endocardial end-diastolic and end-systolic LV volumes from empirical analysis, using the multislice transverse cardiac images, and the single longitudinal slice elliptical model for both the WKY (n = 7; ▵, end-diastolic; ⋄, end-systolic) and SHR (n = 6; □, end-diastolic; ○, end-systolic) groups. No significant difference in the relationship between these groups is evident. There is a linear correlation (r = 0.95) with a line of best fit y = 1.03 (± 0.07) x - 11 (± 22) μl (63.8% confidence intervals).
