
Figure 4. The iIPSC shows a faster time to peak and decay time constant than the oIPSC, suggesting that it may have a more proximal origin.
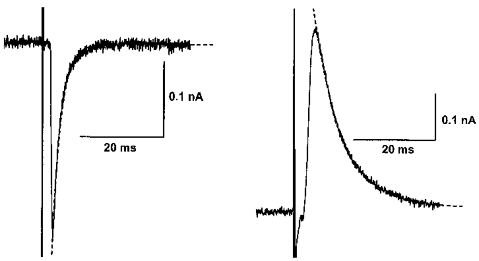
IPSCs from 2 different cells where electrical stimulation evoked either a pure iIPSC (left) or a pure oIPSC (right) at the holding potential of −70 mV. Time to peak of the iIPSC is 0.8 ms, while that of the oIPSC is 2.7 ms. Decay time constants, estimated by fitting to a single exponential curve (dashed lines), were 2.0 ms (iIPSC) and 6.9 ms (oIPSC), respectively.