
Figure 2. A single Ca2+ spark and the resulting biphasic current (STOIC).
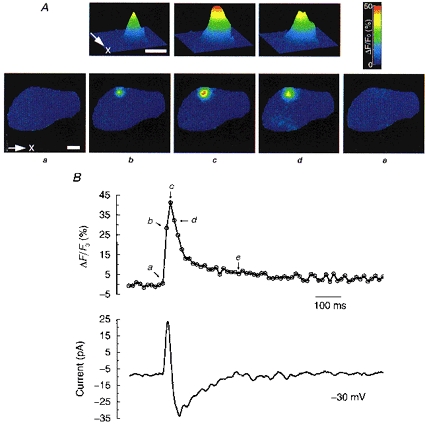
A, images showing the time course of a single Ca2+ spark acquired at the times designated in the upper trace of B. Images in the lower row of A show the entire cell. Contour plots in the upper row of A show the spark at higher spatial resolution. Calibration bar is 5 μm. B, upper trace tracks the time course of the change in [Ca2+] in the one pixel (333 nm × 333 nm) where the peak [Ca2+] is reached during the course of the spark. Lower trace shows the current simultaneously recorded at a holding potential of −30 mV.