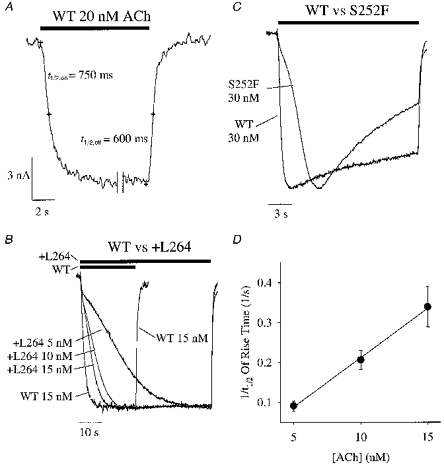
Figure 3. The +L264 and S252F mutations delayed the rising phase of the 5–15 nm (+L264) and 30 nm (S252F) ACh response.

A, the rising and falling phases of the WT response to 20 nm ACh at an expanded time scale. We deleted the steady-state portion of the response between the double vertical lines. The small crosses superimposed on the traces denote from left to right the start of the ACh application, the half-rise time of the ACh response (t½,on), the end of the ACh application, and the half-fall time of the ACh response (t½,off). Note that the t½,on and t½,off values were approximately equal for the WT response. The bar above the traces indicates the timing of ACh application. B, WT response to a 15 nm ACh concentration jump superimposed on +L264 responses to 5, 10 and 15 nm ACh concentration jumps (+L264 traces from a single oocyte) after normalizing the responses to the same peak value. Bars above the traces show the timing of the ACh application. C, superimposed and normalized S252F and WT 30 nm ACh responses. D, the reciprocal of the half-rise time (1/t½) of the +L264 ACh response increased linearly with the ACh concentration ([ACh]). Error bars are ±s.e.m. (n = 7–8). Vh =−50 mV.
