
Figure 4. WT, S252F and +L264 ACh concentration-response relations at −50 mV.
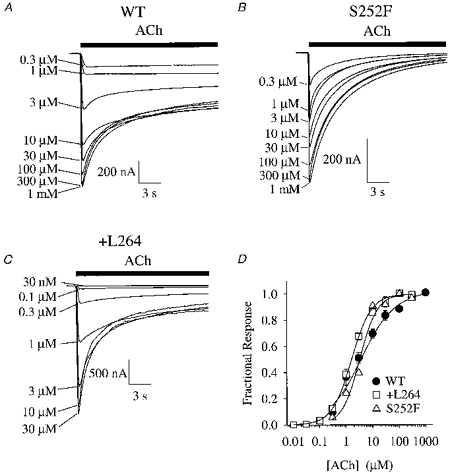
A-C, WT, S252F and +L264 responses to a series of increasing ACh concentrations. Bars above the traces indicate the duration of the step application of ACh from the microperfusion system. Note the rapid desensitization of the S252F response. D, normalized WT, S252F and +L264 ACh concentration-response relations. Lines are fits to the Hill equation (see Methods). See text for fit parameters. Error bars are ± se.m. Symbols obscure most error bars.