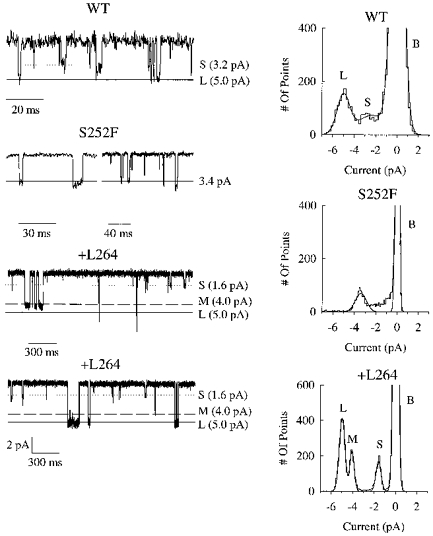
Figure 9. Conductance states of the WT, S252F and +L264 channels.

Left panels, sample traces of WT, S252F and +L264 channel openings (downward) in outside-out patches. Recordings were filtered at 1 kHz and sampled at 5 kHz. Vertical scale (under the +L264 traces) is identical for all three receptors. Horizontal lines show the mean current levels determined from the all-points histograms on the right. Right panels, all-points histograms of single-channel currents from patches shown on left (includes data not shown in traces). B, S, m and L denote the baseline current and the small, medium and large channel currents. Smooth curves are fits to the sum of multiple Gaussians. Vh =−100 mV.
