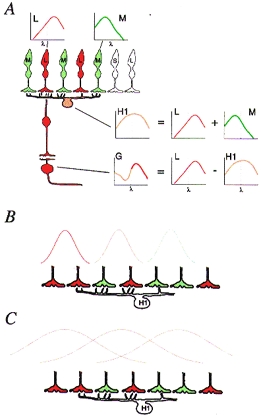
Figure 3.

A, schematic view of the retina showing the key features of the ‘random wiring’ hypothesis for generation of spectral opponency. The small graphs show spectral sensitivity for the cone photoreceptors (L and M), an H1 horizontal cell and a midget ganglion cell (G). The H cell spectral sensitivity is a combination of m and L cones, and hence is broader than that of either cone alone. The G cell spectral response is the difference between the single cone response and the horizontal cell response. B and C, schematic representations of horizontal cell inputs to bipolar cell receptive fields. The hypothetical curves represent the relative efficacy of stimulation at progressively greater distances from reference points at different positions in the dendritic field of the horizontal cell. The curves in B and C have different space constants. If the space constant is small (B), the strongest effect at a given point of the horizontal cell will be due to activity in a small number of cones. This would lead to variation in spectral weighting of the inhibition for each local domain within the H cell field, according to the local distribution of m and L cones. If the space constant is larger (C) the spectral weighting would be closer to the average of the m and L cones.
