
Figure 3. SBF measurements.
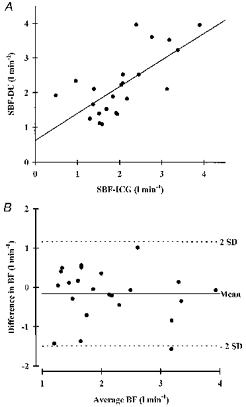
A, splanchnic blood flow obtained by the dye-elimination technique (SBF-ICG) and duplex ultrasound (SBF-DU) at rest, after a meal and during postprandial cycling (n = 8). B, agreement in blood flow assessment: difference between dye-elimination technique and duplex ultrasound values (SBF-ICG - SBF-DU) plotted against average SBF values ((SBF-ICG + SBF-DU)/2). s.d., standard deviation; BF, blood flow. Mean ± 2 s.d. defines the 95% limits of agreement.