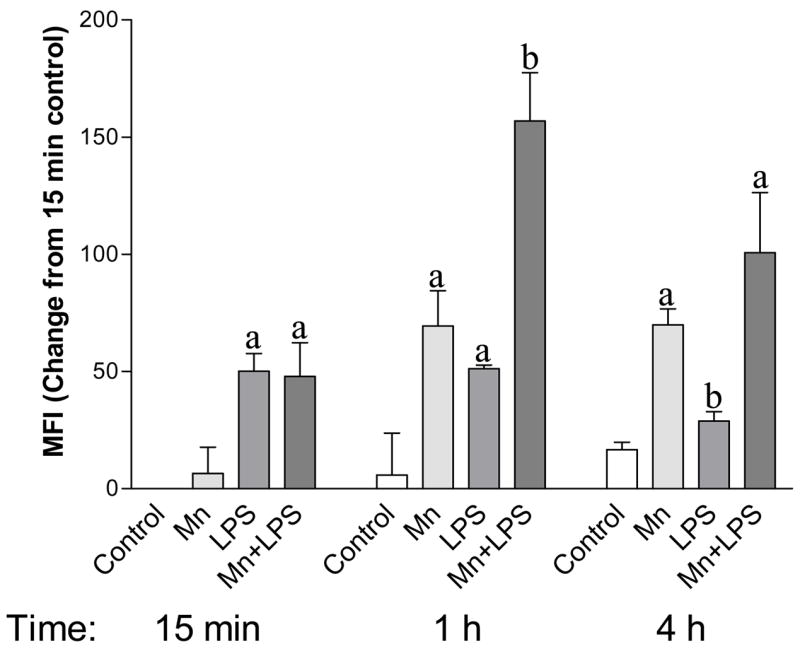
Figure 3.

Phosphorylated p38 protein levels in whole cell lysate of N9 microglia exposed to 250 μM with or without 100 ng/ml LPS. Whole cell lysates collected after 15 min, 1 h, or 4 h were analyzed by flow cytometry as described in the Materials and Methods. Data shown represent the mean fluorescence intensity (MFI) change from the 15 min control ± S.E.M. for two independent experiments where each experimental condition was independently replicated (n = 4). For abbreviations please refer to the legend on Figure 1. a, b Presence of letters on top of bars indicate treatment differences in phosphorylated p38 levels within a time point with bars with different letters being different from each other and from bars without a letter (P < 0.05).
