
Figure 3.
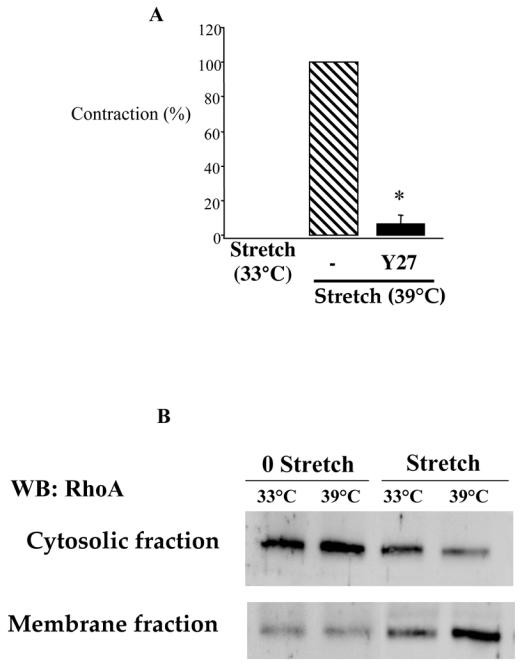
Inhibition of myogenic tone by Y27632 (l0 μmpl/L), in rabbit facial vein segments mounted in a myograph (A). Data is presented as percentage (%) of myogenic tone. 100% is corresponding to myogenic tone in the absence of inhibitor and control is corresponding to the vein segments stretched at 33°C, thus not developing myogenic tone. Mean ± sem is presented (n= 7 per group). *P<0.05, Student’s t-test, versus control.
The low panel (B) represents a Western-blot analysis of Rho in control conditions (vein segments stretched at 33°C) or in the presence of myogenic tone (stretched segments at 39°C). Cytosolic (C) and membrane (M) fractions were separated before migration so that the translocation of Rho to the membrane could be visualized as a change in the ratio of the cytosolic to the membrane fraction. Temperature per se had no effect on RhA translocation (no stretch at 33 versus 39°C). Each blot is representative of 5 different experiments.