
Figure 6.
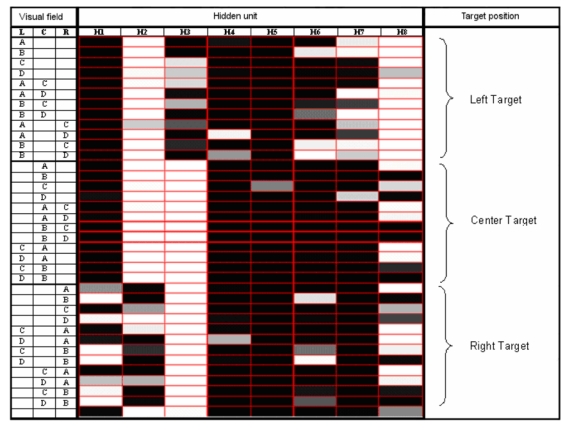
Activation value of the 8 hidden units in response to the 36+1 possible visual patterns, i.e. the possible contents of the eye’s visual field (L=Left area of the eye’s visual field; C=Central area; R=Right area). The patterns are grouped in three sets based on target position, plus the case in which no object was presented. Activation values are designed by a grey scale (black=0; white=l).