
Fig. 3.
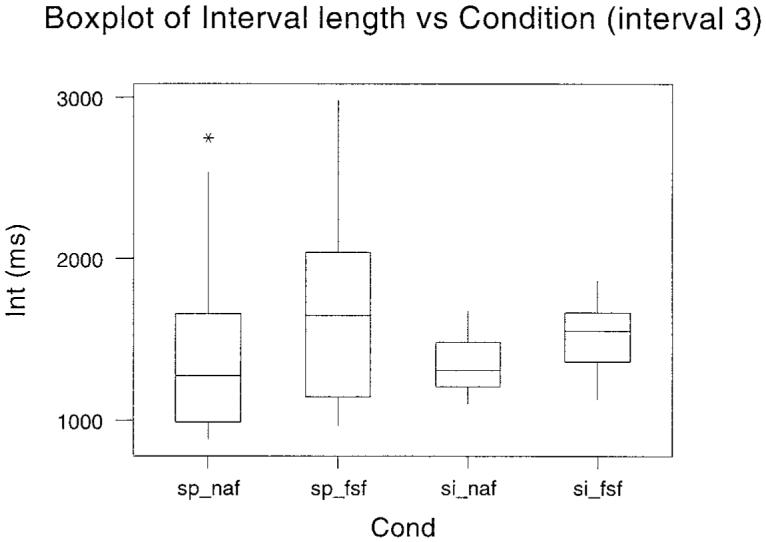
Boxplots of the interval between segmentation point 1 and segmentation point 4 for the four separate conditions conducted in Experiment 2. The experimental condition is given along the abscissa. The mean value is the bar within the box, and the box itself indicates the interquartile range. The range of measurements is shown by the whiskers.