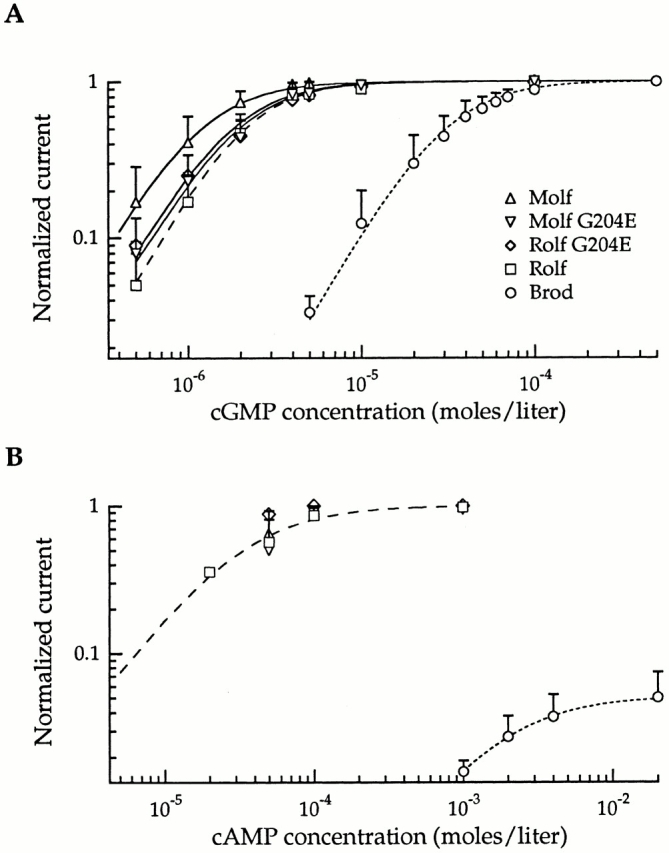
Figure 2.

Sensitivities to cGMP and cAMP of Molf G204E and Rolf G204E CNG channels were similar to those of the wild-type Molf and Rolf channels. Brod and Rolf data are from the companion article (Crary et al. 2000, in this issue). Steady state, cGMP-activated currents were measured at +100 mV. (A) cGMP dose–response curves for the three wild-type channels, Molf G204E, and Rolf G204E channels. SDs are indicated by error bars. Smooth curves were drawn by fitting the averaged data with the Hill equation, I/I max = [cNMP]n/(K1/2 n + [cNMP]n), where I is the cGMP- or cAMP-activated current, I max is the cGMP-activated current obtained at saturating cGMP, K1/2 is the concentration of cGMP or cAMP giving half-maximal activation, and n is the Hill coefficient. In fitting the data, this relation was scaled to match the measured maximal I/I max (e.g., the maximal I/I max for the rod channel in the presence of saturating cAMP was only 0.05 [B], rather than 1, as for saturating cGMP). The Hill relation was used only for an empirical description of the data to quantify changes in the apparent affinity and maximal activation (or inhibition; see Fig. 4 and Fig. 8); it is not meant to suggest a mechanism of channel activation or inhibition by DAG. The calculated K1/2 values were 31 μM (Brod; 11 patches), 1.2 μM (Molf; 10 patches), 2.1 μM (Rolf; 18 patches), 1.9 μM (Molf G204E; 8 patches), and 1.8 μM (Rolf G204E; 6 patches). Hill fits for Brod and Rolf channels are designated by dashed lines for emphasis. (A) Dose–response curves for activation by cAMP; the symbols are the same as those used in A. Averaged data points are shown with the SD as error bars: Brod (8 patches), Rolf (7 patches), Molf (5 patches), Rolf G204E (1 patch), and Molf G204E (4 patches). Hill fits to channel data indicate K1/2 values for activation by cAMP of 1.83 mM for Brod and 37 μM for Rolf and are represented by dashed lines. See Table for additional information.
