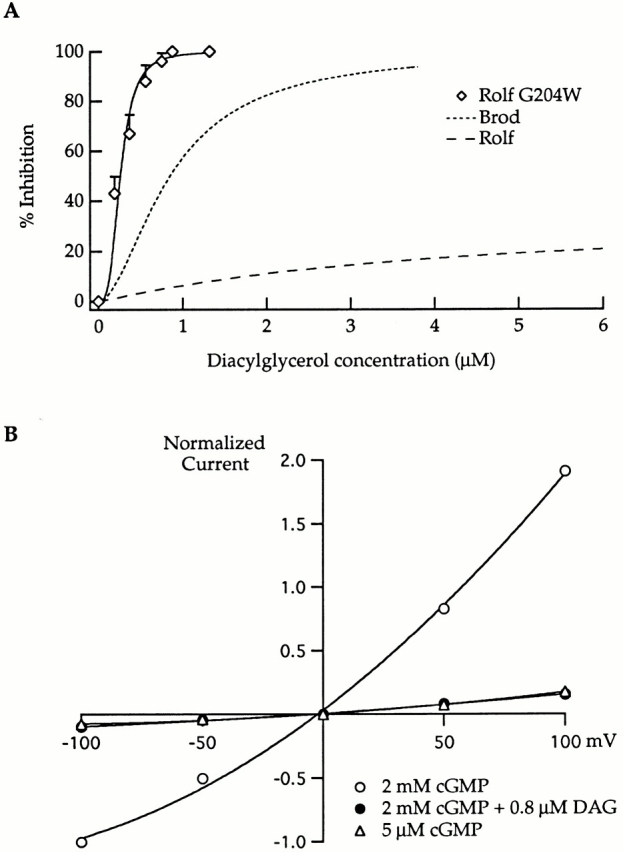
Figure 8.

The Rolf G204W mutant had a slightly greater DAG sensitivity than that of the Brod channel, and its inhibition was similarly voltage-independent (compare with Fig. 4 in companion article, Crary et al. 2000, in this issue). (A) The DAG dose–response curve was measured in the presence of 2 mM cGMP: data were averaged from three patches and fit with the Hill equation. The maximum inhibition for the Rolf G204W mutant was 100% with an IC50 = 0.26 μM and n = 3.2. The Hill fits for the Brod and Rolf channels (from Fig. 4) are shown for comparison as dashed curves. (B) Steady state current–voltage relations obtained from data acquired on a single patch containing the Rolf G204W mutant. Open circles represent cGMP-activated currents at saturating concentrations in the absence of DAG. Filled circles represent currents at saturating cGMP in the presence of 0.8 μM DAG. For comparison, the triangles show the currents at lower (5 μM) cGMP concentration, without DAG.
