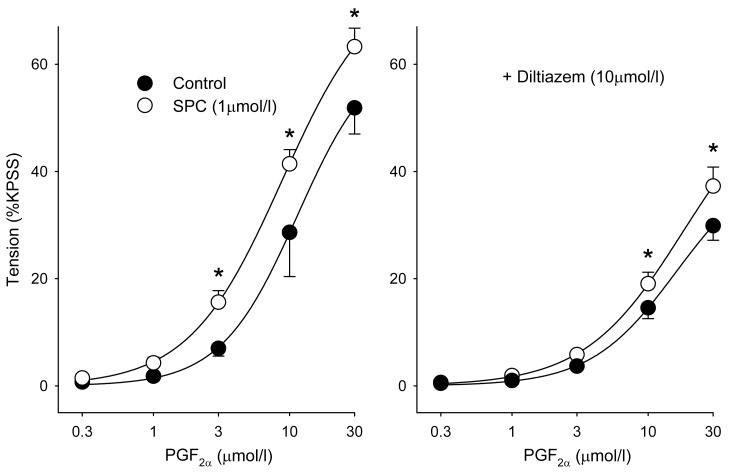
Figure 5.
Cumulative concentration-response relationships for PGF2α in IPA. The left hand panel shows the effect of preincubation with 1 μmol/l SPC (Control, filled circles; SPC, open circles); the right hand panel shows the response in the presence of 10 μmol/l diltiazem. In both cases control and experimental curves were significantly different (-diltiazem: p<0.01, n=4; +diltiazem: p<0.05, n=5; 2 way ANOVA); symbols are mean ± S.E.M., * = p<0.01 (Holm-Sidak post hoc).

