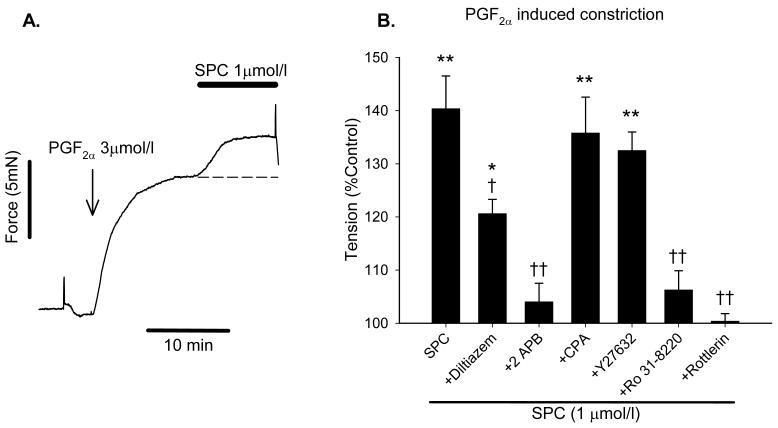
Figure 6.
A: Representative trace illustrating the second, shorter protocol where SPC is added on top of an established stable vasoconstriction induced by PGF2α. SPC was added once developed force reached a plateau, and caused a further increase in force; in the absence of SPC tension was stable for at least 10 min, illustrated by the dashed line. B: Increase in PGF2α-induced force caused by 1 μmol/l SPC measured after 10 min using the protocol shown in A., and following preincubation with inhibitors; 100% represents tension in the presence of inhibitors but before addition of SPC. Bars are mean ± S.E.M., n = 4-12. * = p<0.05, ** = p<0.01 versus control; † = p<0.05, †† = p<0.01 versus SPC.

