
Figure 11.
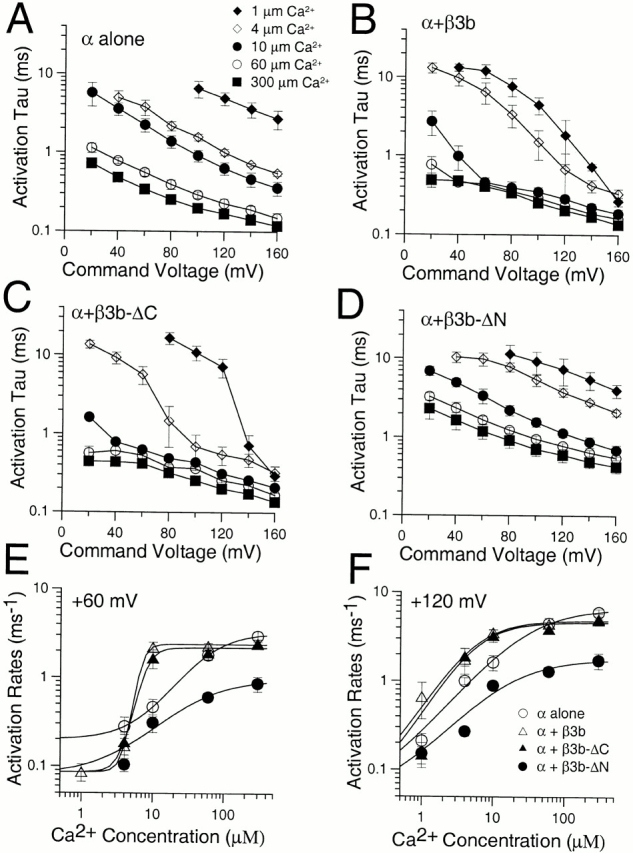
Comparison of activation time constants for α, α + β3b, α + β3b-ΔC, and α + β3b-ΔN. In A, the time constant of activation, τa, for currents arising from expression of the α subunit alone is plotted as a function of command potentials for 1 (♦), 4 (⋄), 10 (•), 60 (○), and 300 (▪) μM Ca2+ for 5–7 patches at each [Ca2+]. Error bars indicate standard deviation. In B, τa is plotted for α + β3b currents. Note the apparent faster time constant for α + β3b currents relative to α alone. Symbols in B–D are identical to those in A. In C, τa is plotted for α + β3b-ΔC currents, showing the similarity with α + β3b currents. In D, τa is plotted for α + β3b-ΔN currents. At all potentials and Ca2+, α + β3b-ΔN currents appear to activate more slowly than those arising from α alone. In E, apparent activation rates at +60 mV were calculated and plotted as a function of Ca2+ for each of the four sets of currents (α, ○; α + β3b, ▵; α + β3b-ΔC, ▴; and α + β3b-ΔN, •). Solid lines represent a fit of k(Ca) = k(0) 1 k max/(1 + ([Ca2+]/K)n) where k(0) is the activation rate at 0 Ca2+, k max is the maximal Ca2+-dependent increase in activation rate, K is the concentration of half effect, and n is the Hill coefficient. For α, α + β3b, α + β3b-ΔC, and α + β3b-ΔN, respectively, the maximal k(Ca) was 3.24, 2.34, 2.18, and 0.96 ms−1, K was 54.7, 6.7, 7.8, and 37.8 μM, and n was 1.4, 6.3, 4.5, and 1.01. Confidence limits on estimates of K and n were large, but at +60 mV the steeper Ca2+ dependence of the apparent activation rate for α + β3b and α + β3b-ΔC currents is clear. In F, apparent activation rates are plotted as in E but for currents measured at +120 mV. For α, α + β3b, α + β3b-ΔC, and α + β3b-ΔN, the maximal k(Ca) was 6.6, 4.9, 4.6, and 1.8 ms−1, respectively, K was 29.1, 5.5, 5.6, and 15.6, respectively, and n was 0.99, 1.33, 1.39, and 0.99, respectively. At +120 mV, the relatively faster intrinsic rate of activation of the β3b and β3b-ΔC constructs compared with +60 mV reduces the effect of inactivation on the apparent activation rate. Note that at both +60 and +120 mV, the limiting maximal k(Ca) for α + β3b-ΔN currents is less than that for any of the other constructs.