
Figure 13.
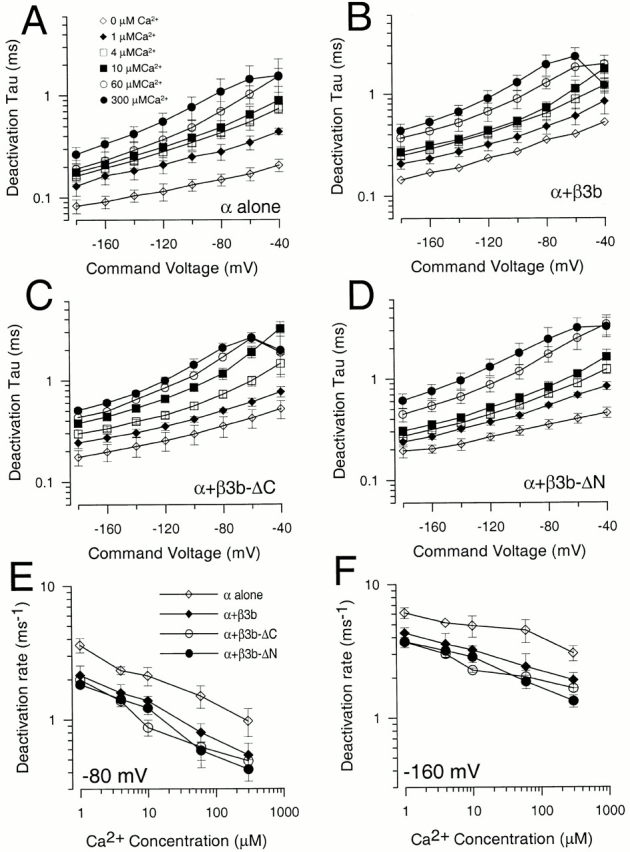
Comparison of deactivation time constants for different β3b constructs. In A, deactivation time constants (τd) obtained from single exponential fits to the tail current time course (Fig. 7) are plotted as a function of repolarization potential for currents from α subunit alone for 0 (⋄), 1 (♦), 4 (□), 10 (▪), 60 (○), and 300 (•) μM. In B, τd is plotted as a function of voltage for α + β3b currents with symbols as in A. In C, τd is plotted as a function of voltage for α + β3b-ΔC currents. In D, τd is plotted as a function of voltage for α + β3b-ΔN currents. In E, the deactivation rate measured at −80 mV is plotted as a function of Ca2+ for each construct (α, ⋄; α + β3b, ♦; α + β3b-ΔC, ○; and α + β3b-ΔN, •). In F, the deactivation rate measured at −160 mV is plotted as a function of Ca2+ with symbols as in E. Current deactivation for α alone is ∼1.5–2-fold faster than for currents resulting from any β3b construct.